
Landed cost calculation is the arithmetic that separates professional importers from hopeful ones: the journey from an Egyptian FOB quote to the true cost of one carton in your warehouse crosses freight, insurance, duty, port fees, clearance, trucking, and losses — and every line skipped is margin imagined. This guide builds the complete calculation with a full worked table, the percentage shortcuts that estimate it fast, and the five costs even experienced buyers forget.
Table of Contents
- The Full Cost Stack, Layer by Layer
- Worked Example: FOB Alexandria to Warehouse Shelf, Line by Line
- Fast Estimation Rules That Hold
- The Five Forgotten Costs
- Using Landed Cost to Compare Origins Honestly
- FAQ
- Sources
The Full Cost Stack, Layer by Layer
- FOB price: goods + export packing + delivery to vessel — the quote’s headline, and only the beginning. Incoterm mechanics in the incoterms guide.
- Ocean freight: the reefer or box rate to your port, plus surcharges (bunker, peak season) the quote may footnote.
- Marine insurance: ICC A with reefer-breakdown cover, per the insurance guide — typically 0.3–0.6% of CIF+10%.
- Import duty and taxes: from your national tariff line for the HS code, minus preferences (GAFTA, EU association) a certificate of origin unlocks; plus VAT/GST where applicable — often recoverable, but financed meanwhile.
- Port and terminal charges: handling, plug fees for reefers, inspection fees where quarantine samples.
- Clearance: broker fees and any demurrage/detention your process risks.
- Inland transport: port to warehouse, refrigerated where the cargo needs it.
- Losses: the produce-specific line — weight loss in transit and sorting waste on arrival, applied as a divisor, not a footnote.
Worked Example: FOB Alexandria to Warehouse Shelf, Line by Line
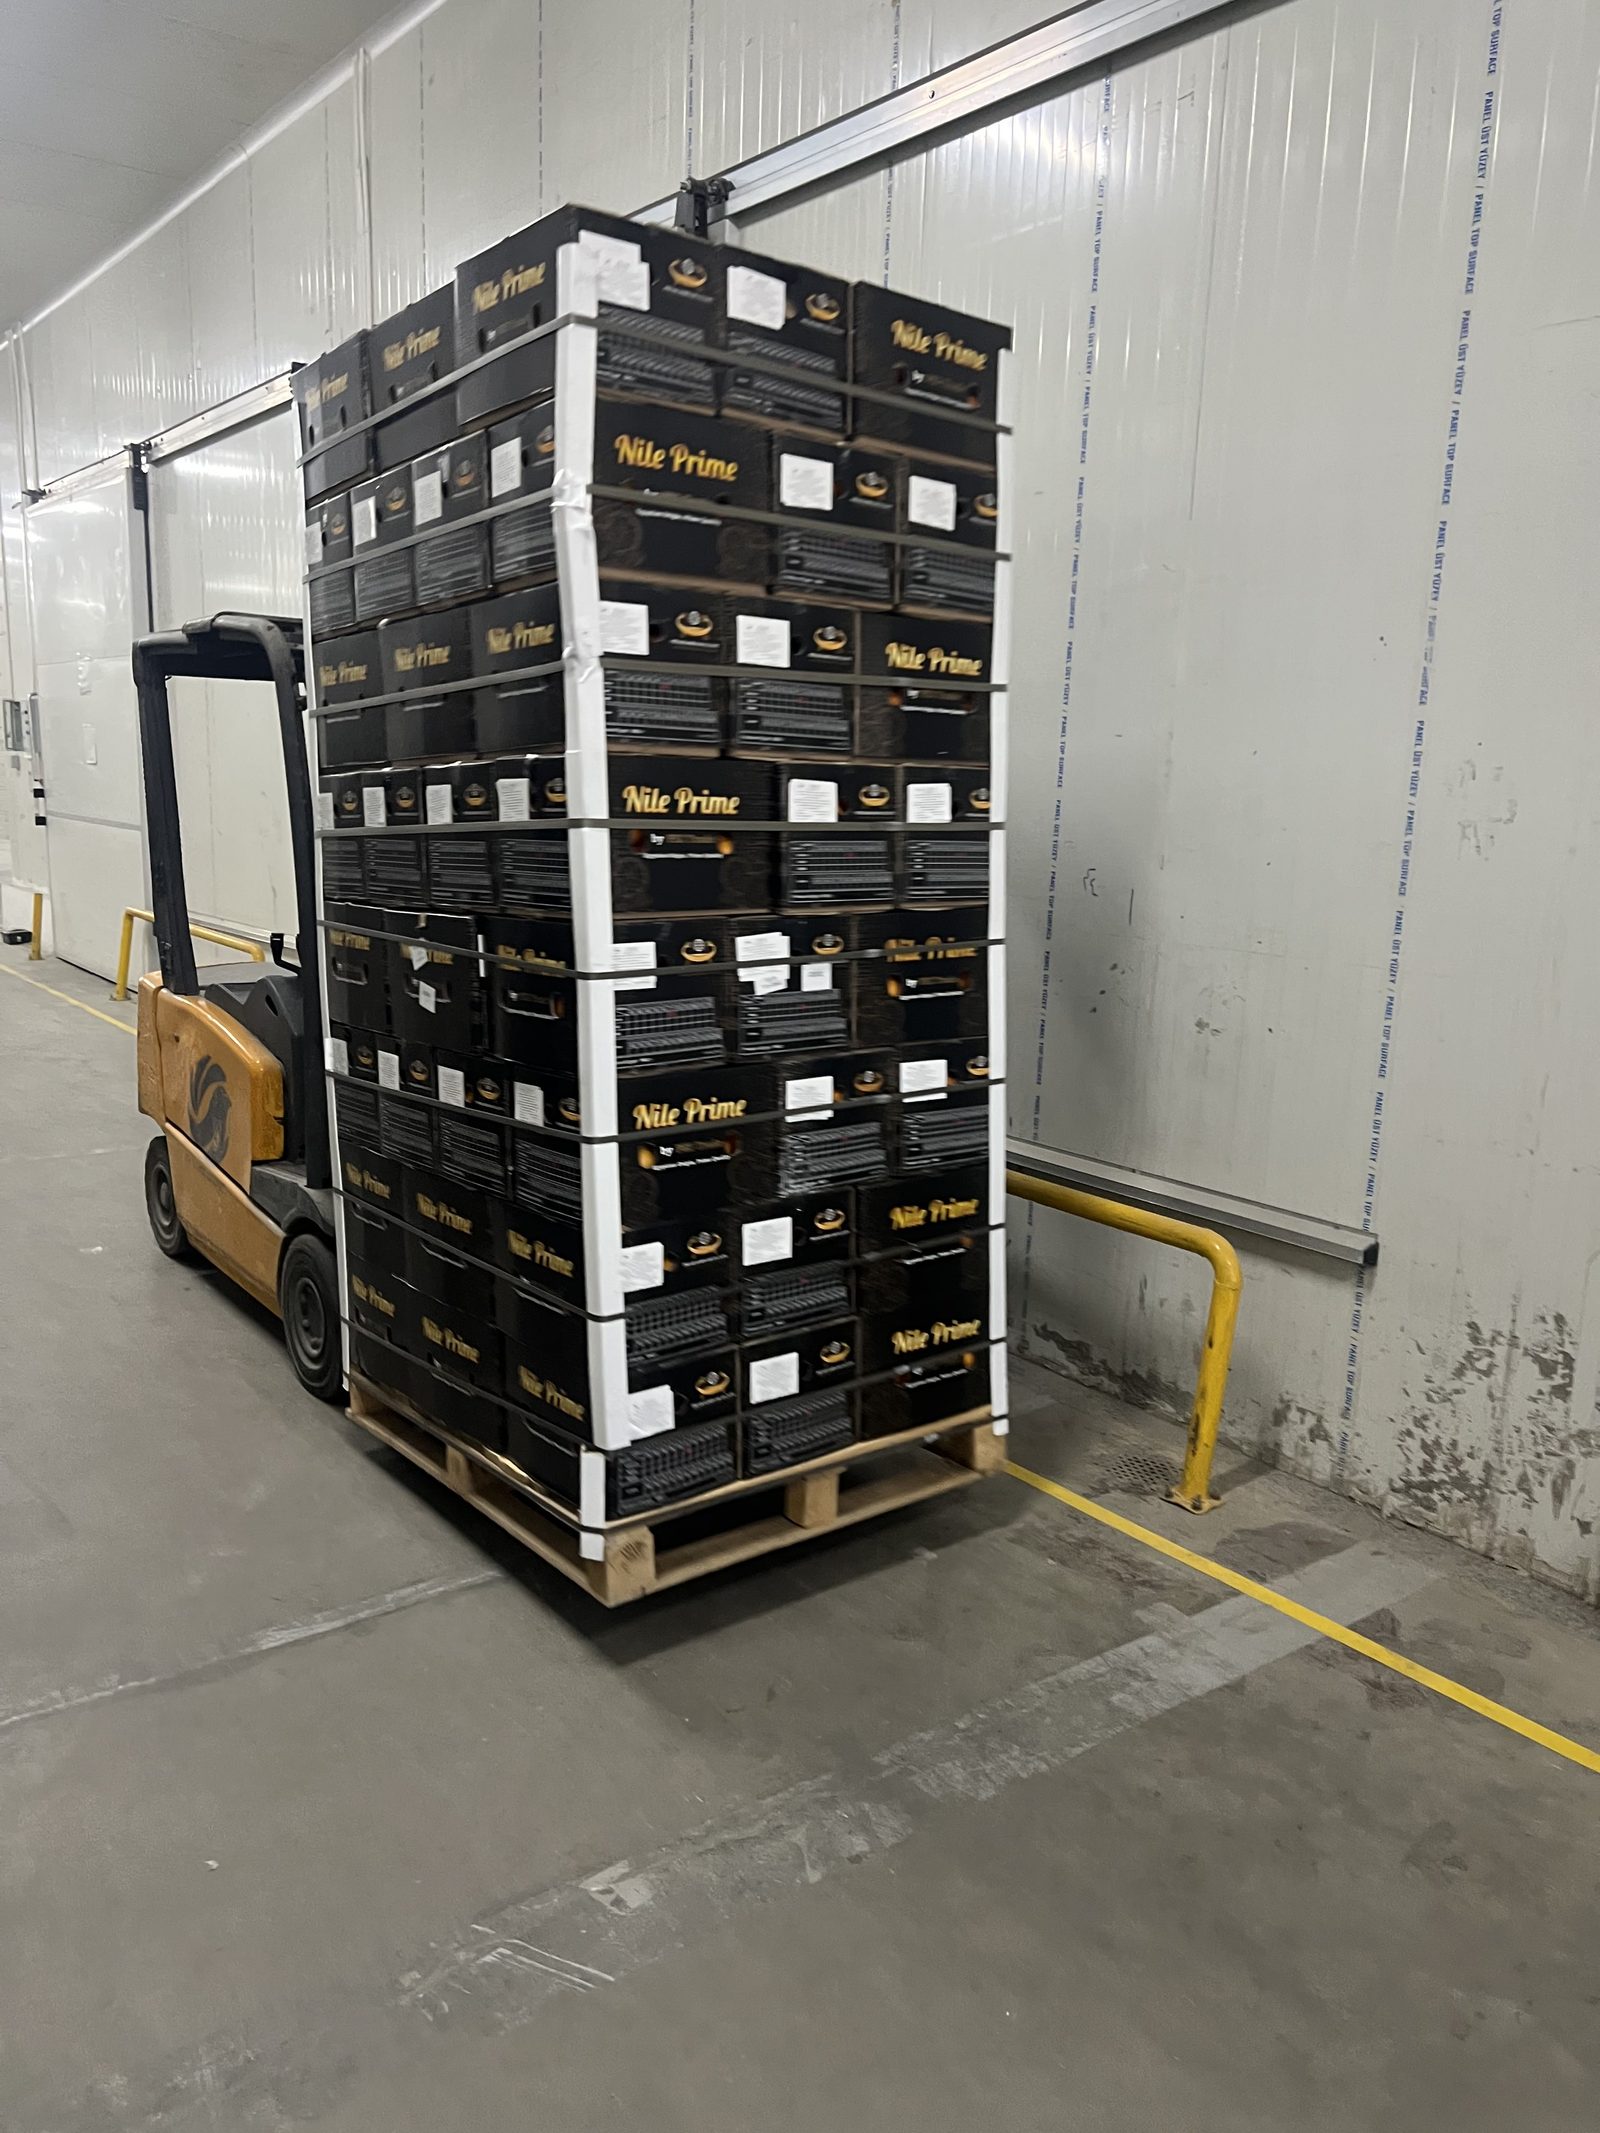
A hypothetical Rotterdam importer prices one 40RF of Egyptian Navel oranges — 20 pallets, 1,600 cartons of 15 kg (24 tonnes). All numbers illustrative; the structure is the product:
| Line | Amount | Running Total |
|---|---|---|
| FOB Alexandria (1,600 × $9.00) | $14,400 | $14,400 |
| Ocean freight (reefer, incl. surcharges) | $3,400 | $17,800 |
| Insurance (ICC A + reefer clause, 0.45% × CIF+10%) | $88 | $17,888 |
| EU duty (entry-price system, preference applied) | $540 | $18,428 |
| Terminal handling + reefer plug | $420 | $18,848 |
| Customs broker + phyto inspection fee | $310 | $19,158 |
| Truck to warehouse (reefer) | $450 | $19,608 |
| VAT (financed; recoverable) | — | $19,608 |
| Landed cost before losses | $19,608 | |
| Arrival sorting waste 3% (÷0.97) | $20,214 effective |
The punchlines: the $9.00 carton truly costs $12.63 at the warehouse ($20,214 ÷ 1,600) — a 40% uplift on FOB; and the sorting-waste divisor added $606 that most spreadsheets never see. Selling against FOB-plus-freight math while paying full-stack costs is how importers earn less than their spreadsheets promise, month after month, without knowing why.
Fast Estimation Rules That Hold
- FOB × 1.35–1.45 approximates landed cost for Mediterranean-to-Europe reefer lanes at normal freight — good enough for a first screen, never for a contract.
- FOB × 1.25–1.35 for the short Gulf lanes from Sokhna, where freight per kilo runs lower.
- Freight per kilo beats freight per container for comparisons: $3,400 ÷ 24,000 kg = $0.14/kg makes cross-origin math instant.
- Duty changes everything: markets with preferences (GAFTA zero, EU association reductions) vs full-tariff markets can swing landed cost 5–20% — check before quoting, not after.
- Waste is a divisor: 3% waste means ÷0.97, not −3% — the difference compounds at scale.
The Five Forgotten Costs
The lines that ambush new importers: working-capital interest — money paid at shipment earns nothing for 30–60 days, and at commercial rates that’s 0.5–1% of deal value per cycle, per the trade finance guide; currency conversion spreads — banks quietly take 0.5–2% on the exchange, per the currency guide; reefer plug-in fees at terminals for every day a powered box waits; quarantine inspection delays — the sampling fee is small, the day of demurrage it can trigger is not; and the empty-return leg — detention clocks run until the box goes home, and trucking that return costs real money in some geographies. None is large alone; together they routinely eat 2–4% — which, on produce margins, is often the difference between a good quarter and a flat one.
Using Landed Cost to Compare Origins Honestly
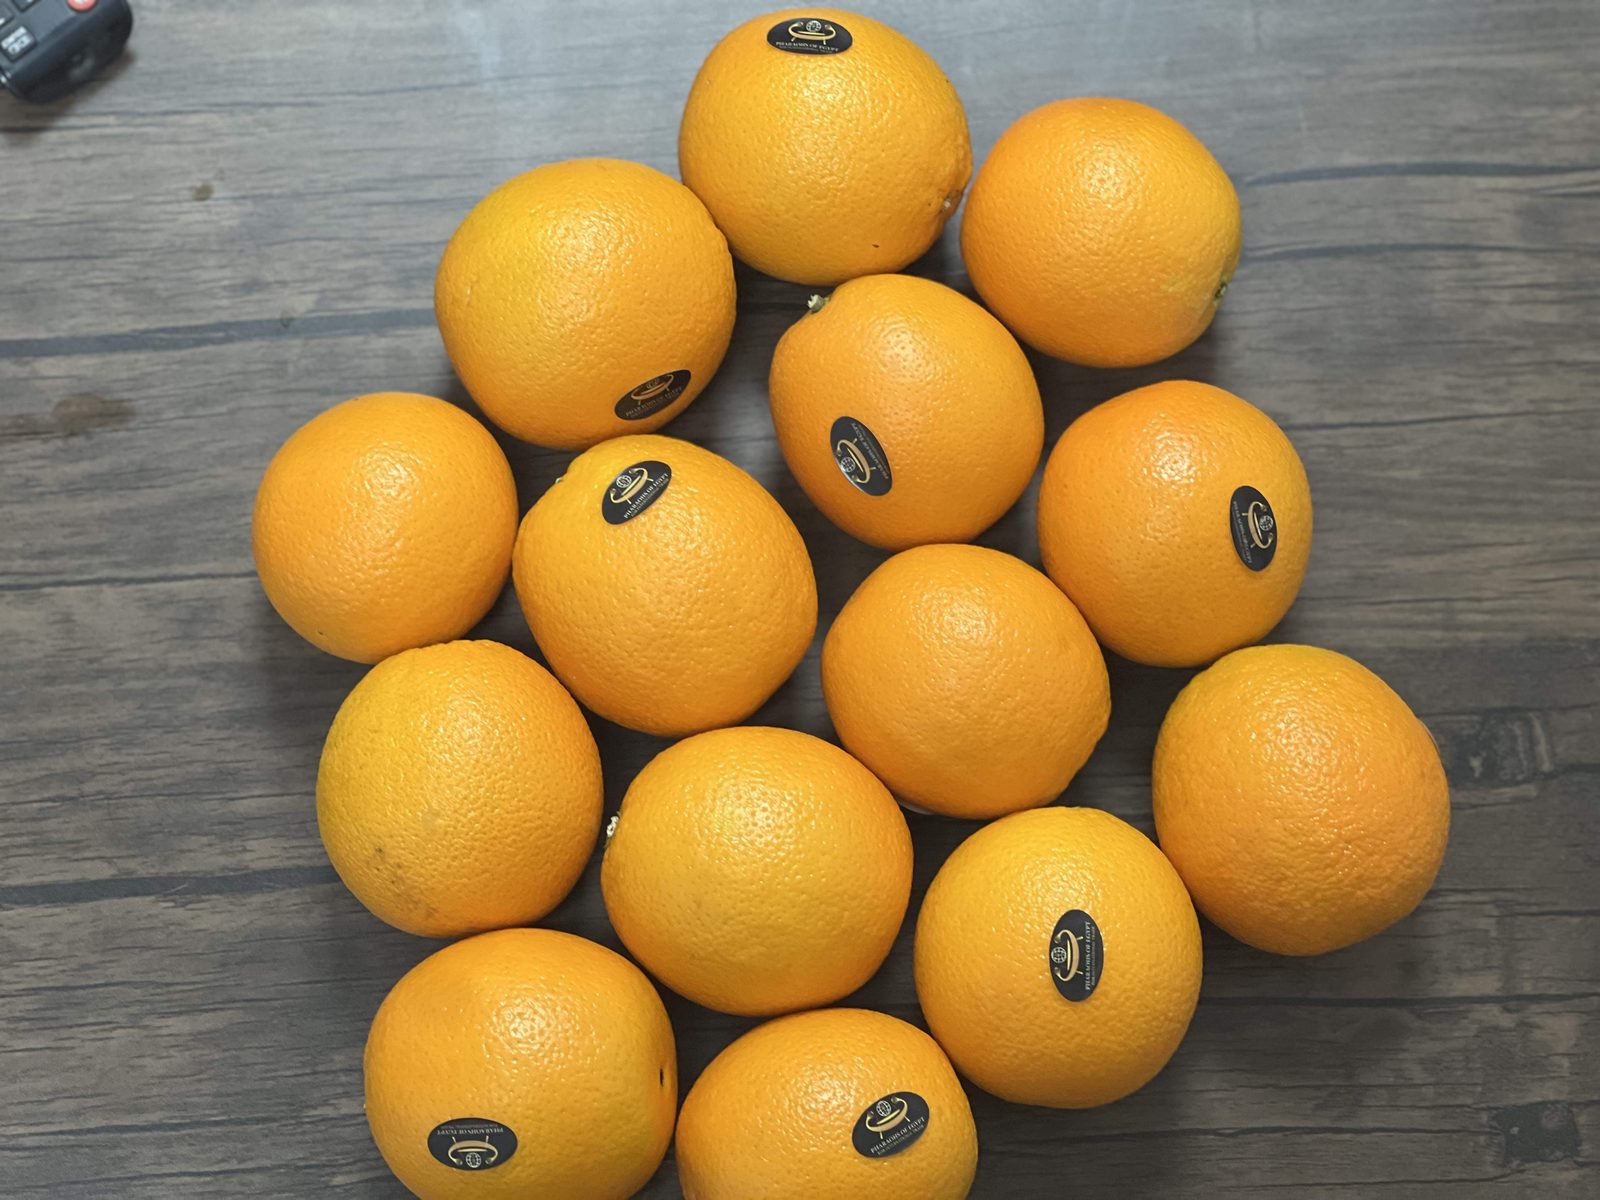
Landed cost is also the only honest way to compare Egypt against competing origins: Spanish oranges carry no EU duty and cheap short freight but a higher FOB; Egyptian fruit inverts the structure; South African citrus adds long-haul freight to counter-season timing. Build the same table per origin — FOB, freight/kg, duty after preferences, waste rate from actual arrival history — and let the bottom line argue. Run seasonally, too: the price guide shows Egyptian FOB moving through the season, and a February landed comparison can reverse November’s conclusion. Buyers who run this table quarterly stop having opinions about origins and start having data.
FAQ
What is landed cost in produce importing?
The complete cost of goods delivered to your warehouse: FOB price plus ocean freight, insurance, import duty and taxes, port and terminal charges, customs clearance, inland transport — divided by the sellable fraction after transit and sorting losses.
How much does landed cost exceed the FOB price?
Typically 25–45% above FOB for Egyptian produce, depending on lane and duty treatment: roughly ×1.25–1.35 on short Gulf lanes, ×1.35–1.45 to Europe — before waste adjustment and financing costs.
How should produce waste be included in landed cost?
As a divisor on the sellable quantity, not a subtraction: 3% arrival waste means dividing total cost by 0.97. On a $19,600 container that adds roughly $600 of true cost that percentage-subtraction math hides.
Which costs do importers most often forget?
Working-capital interest on advances, bank currency spreads, reefer plug fees at terminals, quarantine-triggered demurrage, and empty-container return trucking — collectively 2–4% of deal value on typical lanes.
Sources
World Customs Organization — valuation and tariff frameworks (wcoomd.org) · European Commission TARIC — EU tariff database (taxation-customs.ec.europa.eu) · Drewry — container freight rate indices (drewry.co.uk) · PEI Trade — FOB and CFR quotation practice for Egyptian produce · International Chamber of Commerce — Incoterms 2020 (iccwbo.org).