
Egyptian onion prices for export move on a rhythm every serious buyer eventually memorizes: new-crop lows in spring, storage-driven firming through autumn, and the periodic India-shock spikes that reprice the whole world market in a week. This guide maps the seasonal price curve, the five forces that actually move FOB quotes, how red and golden price against each other, and a worked season of buying decisions. Product fundamentals live in the onions export guide.
This page explains how Egyptian onion prices behave; it does not publish price levels. Last updated: July 2026.
Table of Contents
- The Seasonal Price Curve, Month by Month
- The Five Forces That Move Egyptian Onion Prices
- Red vs Golden, Size and Format Spreads
- Worked Example: One Buying Season, Four Decisions
- FAQ
- Sources
The Seasonal Price Curve, Month by Month
| Period | Supply State | Where the Curve Sits (golden, 25 kg mesh) |
|---|---|---|
| March–May | New crop floods in; curing completes | The seasonal floor |
| June–August | Fresh-cured peak; Gulf summer demand | Off the floor, still the comfortable half of the year |
| September–November | Storage season; quality re-sorts the field | Firming month by month as storage carry accrues |
| December–February | Stored crop only; Northern Hemisphere gap | The seasonal crown — the year’s dearest weeks |
| Any India-ban week | Global panic bid | A sharp spike above the whole curve, usually brief |
Nile Prime does not publish a price list. FOB moves week to week with variety, grade, available volume and vessel space, and a figure fixed at publication misleads more than it helps. For a current number against your spec and destination port, ask the desk — it comes back the same working day.
The shape repeats even as levels move with each year’s planting and the EGP. The buying rule it implies matches the Europe guide’s program logic: contract the floor months forward, and never need to buy in the crown months without a frame behind you.
The Five Forces That Move Egyptian Onion Prices
- India’s export policy: the single biggest exogenous force — a ban or minimum-export-price announcement in Delhi reprices Egyptian FOB within days as Bangladesh, Malaysia, and the Gulf redirect demand.
- Planted area feedback: high prices one season plant extra feddans the next; the cobweb cycle gives alternating pressure years.
- Storage quality outcomes: a humid autumn that spoils stored stock tightens winter supply beyond any forecast.
- EGP moves: devaluations soften dollar FOB with the usual lag, per the currency guide.
- Freight and equipment: on a low-value bulk commodity, a swing in container rates is a visible slice of landed cost — the freight-fraction math in milder form.
Red vs Golden, Size and Format Spreads
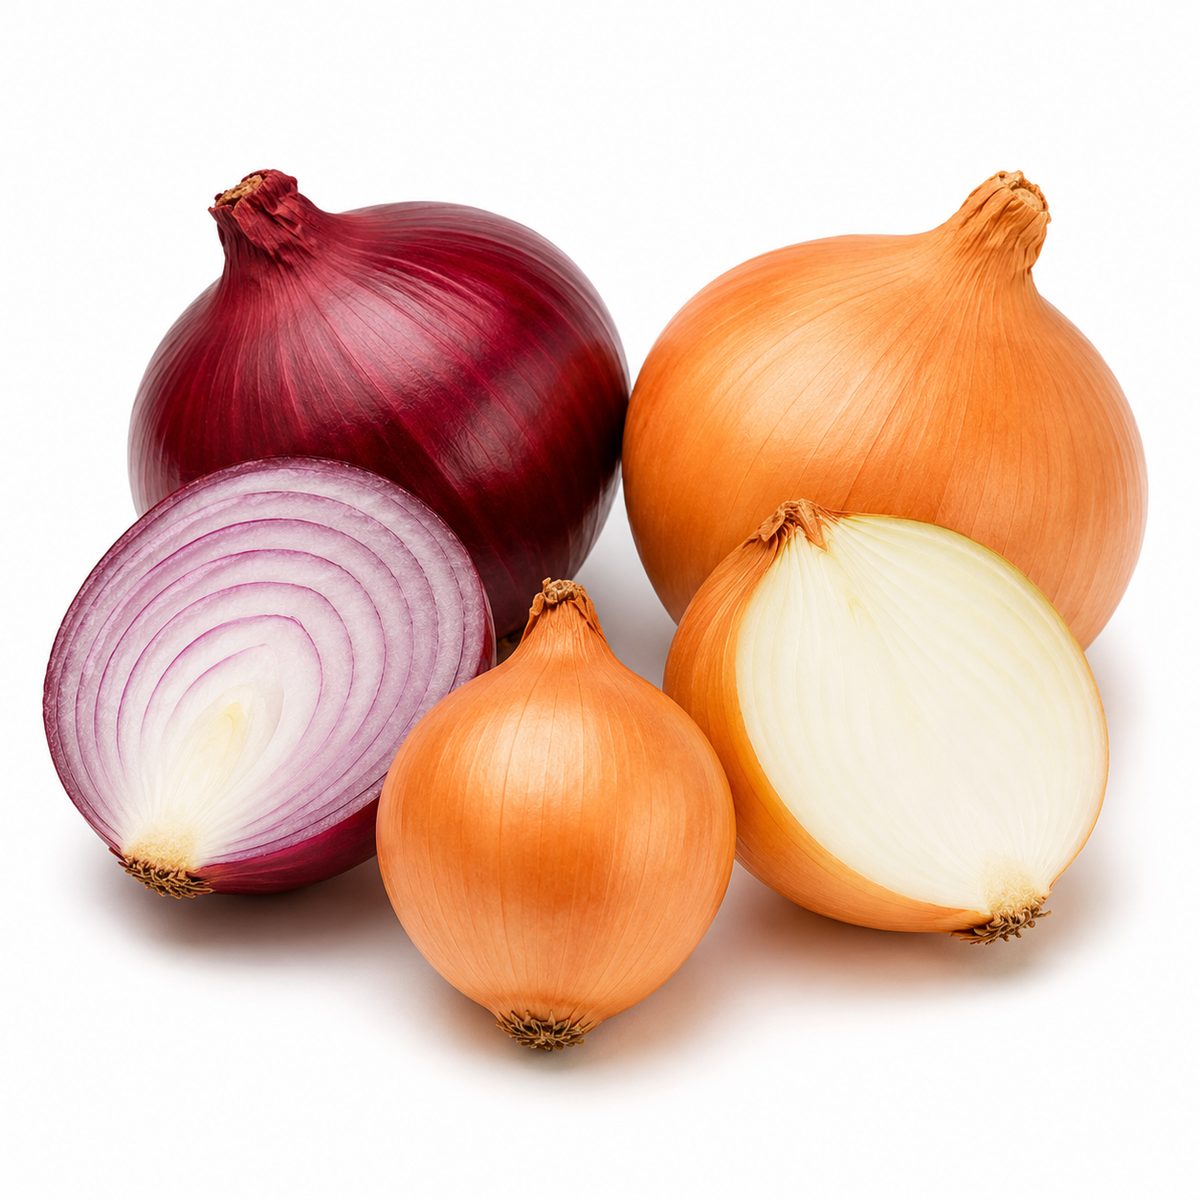
Golden onions set the reference price; reds trade at a premium to them on stronger retail positioning and tighter supply, and that premium widens when Gulf retail promotions bid for color. Size spreads reward the middle: 60–80 mm is the liquid standard; jumbo 80+ earns niche premiums in food service; 40–60 mm discounts into price-driven lanes. Format moves money too — 25 kg mesh is the baseline, 10 kg and 5 kg retail bags carry both the cost and the value of the extra packing, and private-label consumer nets convert a commodity into a margin product. The practical use of spread knowledge: when your size or color spec runs expensive, ask what the curve is telling you — a widening red premium means the crop ran golden-heavy, and a flexible spec captures the value the rigid one pays away.
Worked Example: One Buying Season, Four Decisions
A hypothetical Colombo importer buys ~40 containers of Egyptian onions yearly. His season, decision by decision: Decision 1, February — he signs 24 containers for April–August delivery against the new-crop floor; the frame consumes 60% of his need and one afternoon of negotiation. Decision 2, June — monsoon rumors and an Indian MEP announcement start a spike, and spot offers run well clear of what his frame is costing him. His frame delivers regardless; he adds 4 spot containers — expensive, but sellable into his market’s panic pricing, and his blended cost stays under the market. Decision 3, September — he inspects storage lots by video before committing 8 autumn containers, applying the storage-season re-sort rule: two suppliers pass, one shows sprouting neck-growth and loses the order. Decision 4, December — winter crown prices arrive; he buys nothing, drawing his warehoused autumn stock instead, and watches frame-less competitors buy at the crown. His blended season cost lands under the market average, the entire edge being calendar discipline, purchased in February.
FAQ
What is the price of Egyptian onions for export?
Nile Prime does not publish a price list. The shape is consistent: the March–May new-crop months are the seasonal floor, quotes firm through the storage season, and the December–February stored-crop weeks are the year’s dearest — while an Indian export-policy shock can reprice the whole market in a week. Ask the desk for a current number against your spec and destination port.
When are Egyptian onions cheapest?
March through May, as the cured new crop peaks — the window when program buyers lock season frames covering 50–70% of annual need.
Why do Indian export bans move Egyptian onion prices?
India is the world’s largest onion exporter; when Delhi restricts exports, Bangladesh, Malaysia, and Gulf demand redirects to Egypt within days, bidding up FOB until the policy reverses.
Do red onions cost more than golden from Egypt?
Typically yes — reds carry a premium over golden, reflecting retail positioning and tighter supply; it widens during Gulf promotion seasons and narrows in golden-short years.
Sources
FAO — onion trade statistics (fao.org) · Tridge — onion market intelligence, Egypt (tridge.com) · Indian DGFT — export policy notifications (dgft.gov.in) · PEI Trade — current Egyptian onion quotations · Central Bank of Egypt — exchange data (cbe.org.eg).